Worldwide Coverage
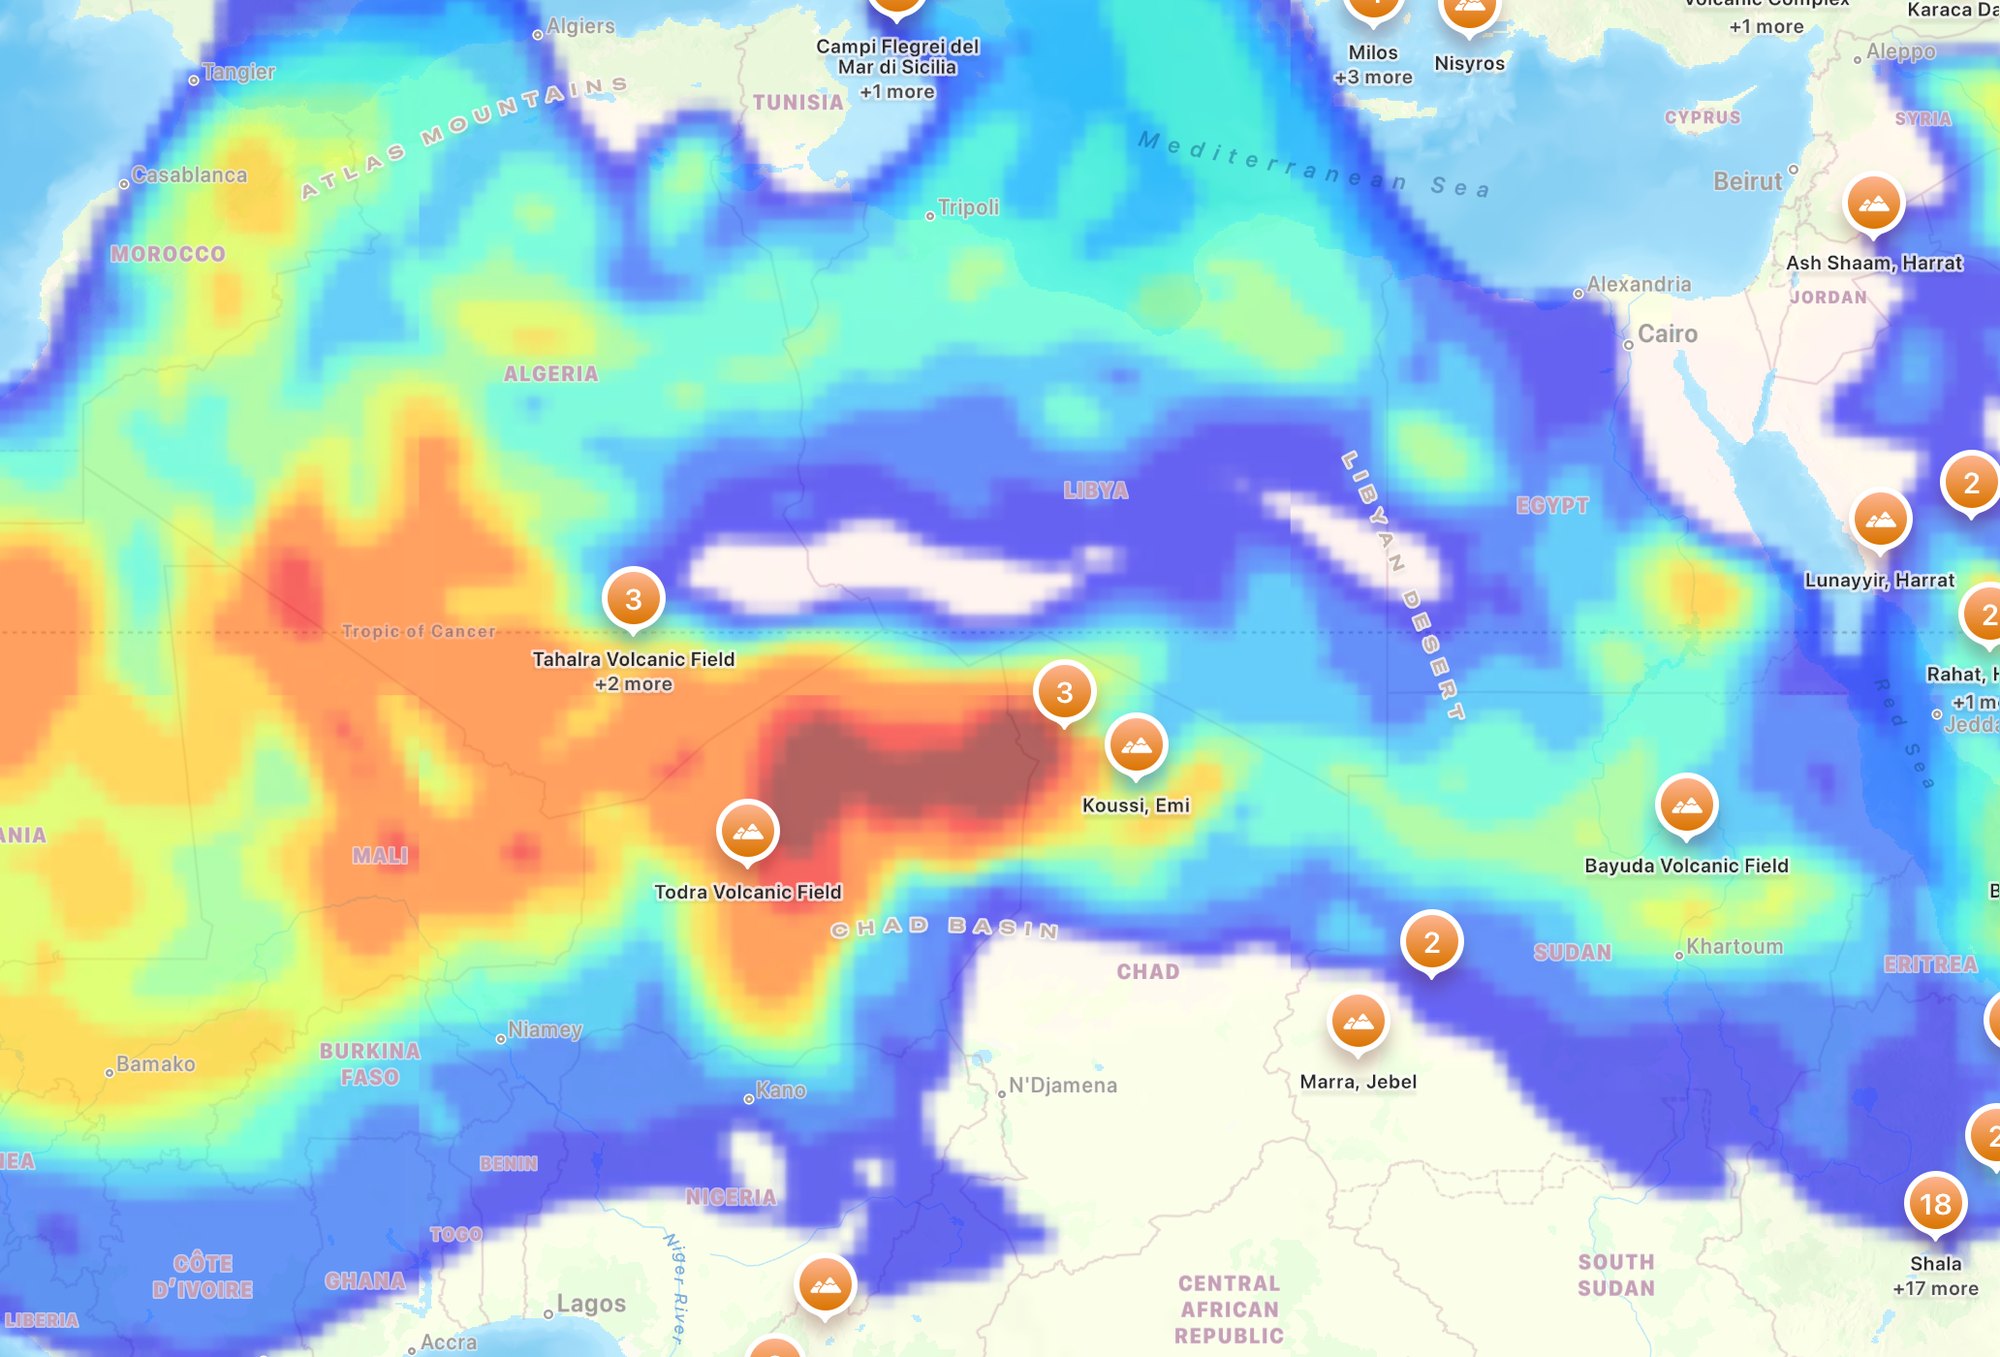
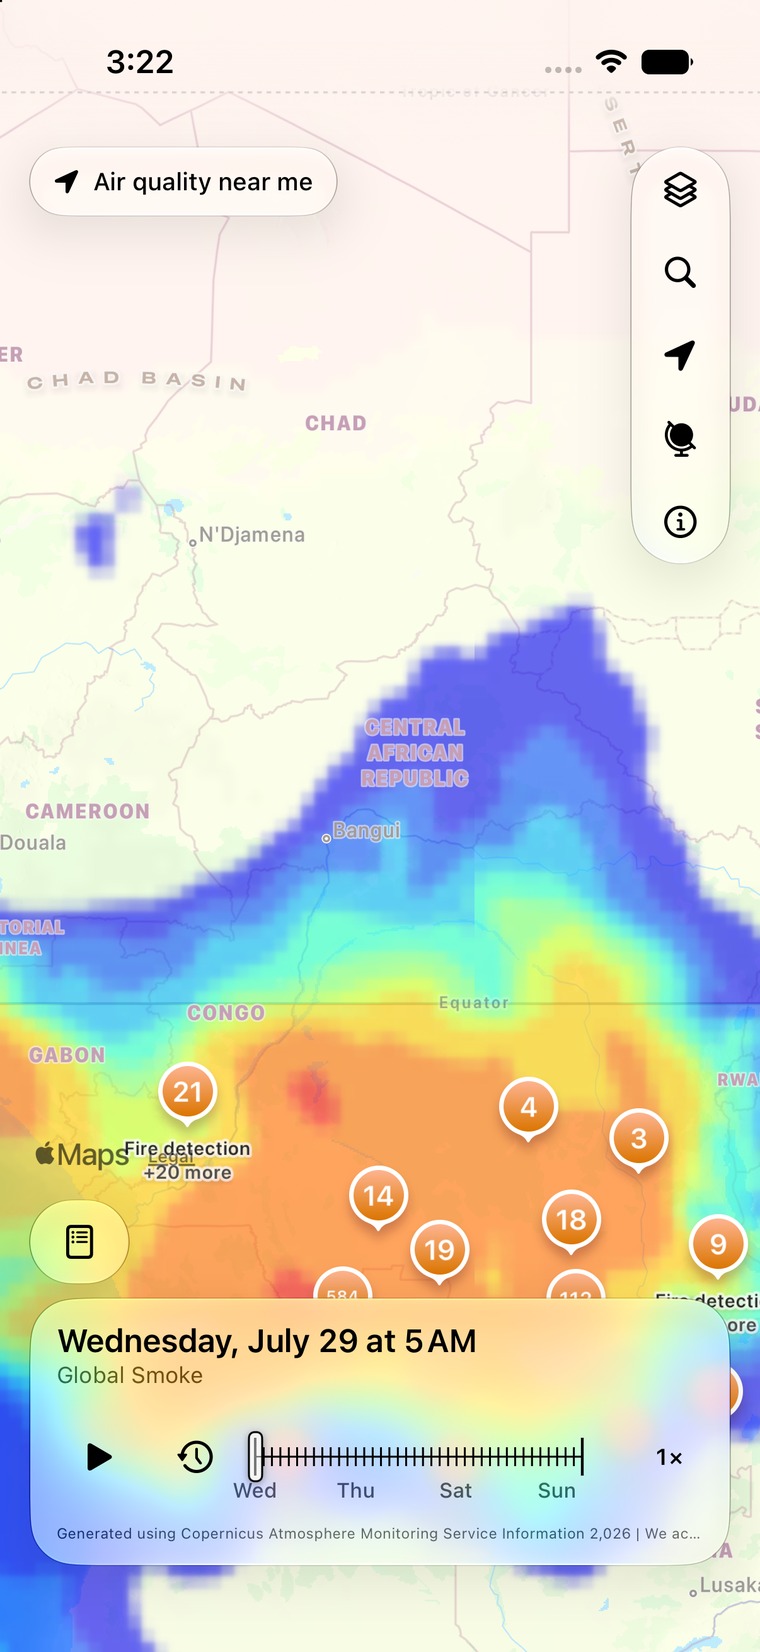
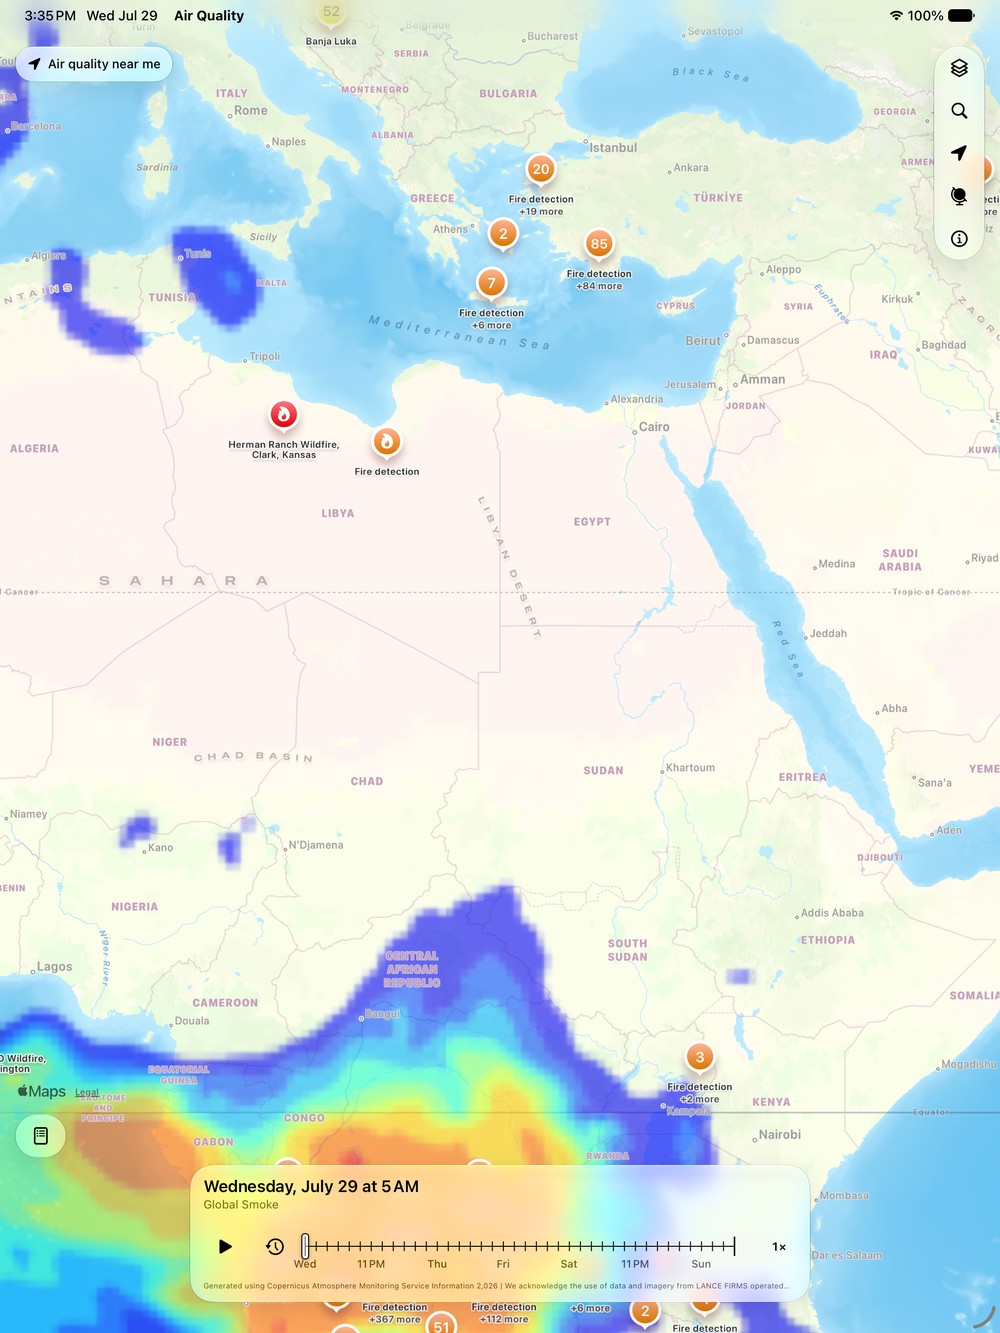
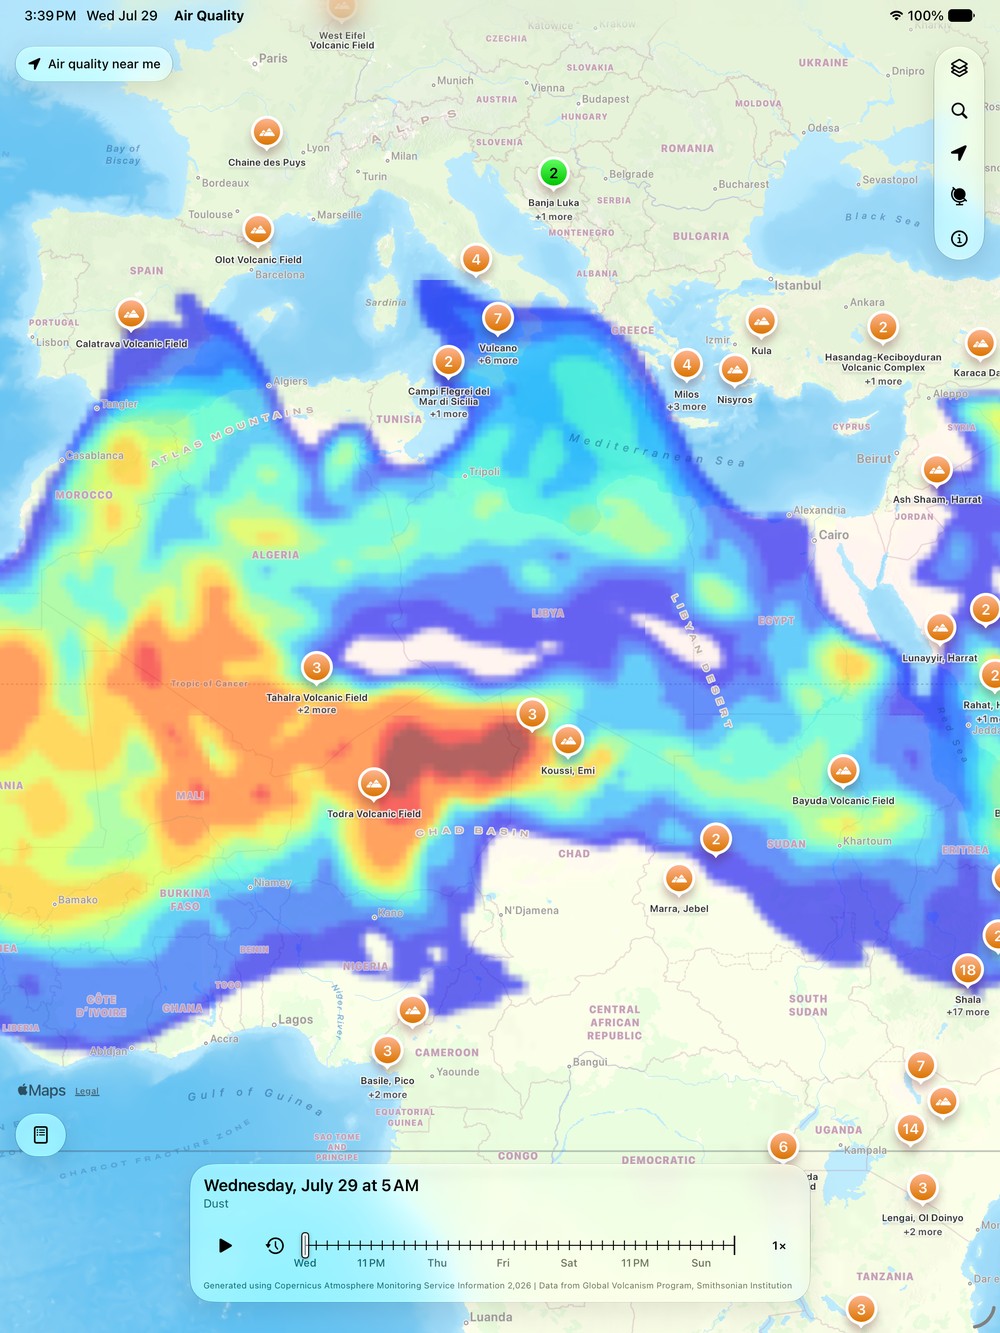
Global smoke, dust, and haze forecasts from Copernicus CAMS — playable up to five days ahead, anywhere on Earth.
Copernicus CAMS · ECMWFAir Quality Index 2.0
Live air quality, smoke, and wildfire forecasts for anywhere on Earth. Free, on iPhone, iPad, Mac, and Apple Vision Pro.
No subscriptions, no ads, no accounts, no tracking.
WWDC24
Air Quality was on Apple Vision Pro when the platform launched, and Apple featured it at WWDC24 as one of the apps that was there on day one. The visionOS version has grown since: the map opens as a window in your space, and there is a volumetric globe you can pick up and turn.
What’s new in 2.0
Version 1 covered smoke across the continental United States. Version 2 covers the whole globe and adds layers for fire hotspots, volcanoes, global sensors, and pollen.
Global smoke, dust, and haze forecasts from Copernicus CAMS — playable up to five days ahead, anywhere on Earth.
Copernicus CAMS · ECMWFSatellite heat detections from the last 24 hours, updated continuously.
NASA FIRMSLive readings from community sensors worldwide, alongside EPA monitors in the US.
OpenAQ · EPA AirNowHolocene volcano locations worldwide, plus a volcanic sulfate forecast layer.
Smithsonian GVPSix pollen species across Europe — birch, grass, olive, ragweed, alder, and mugwort.
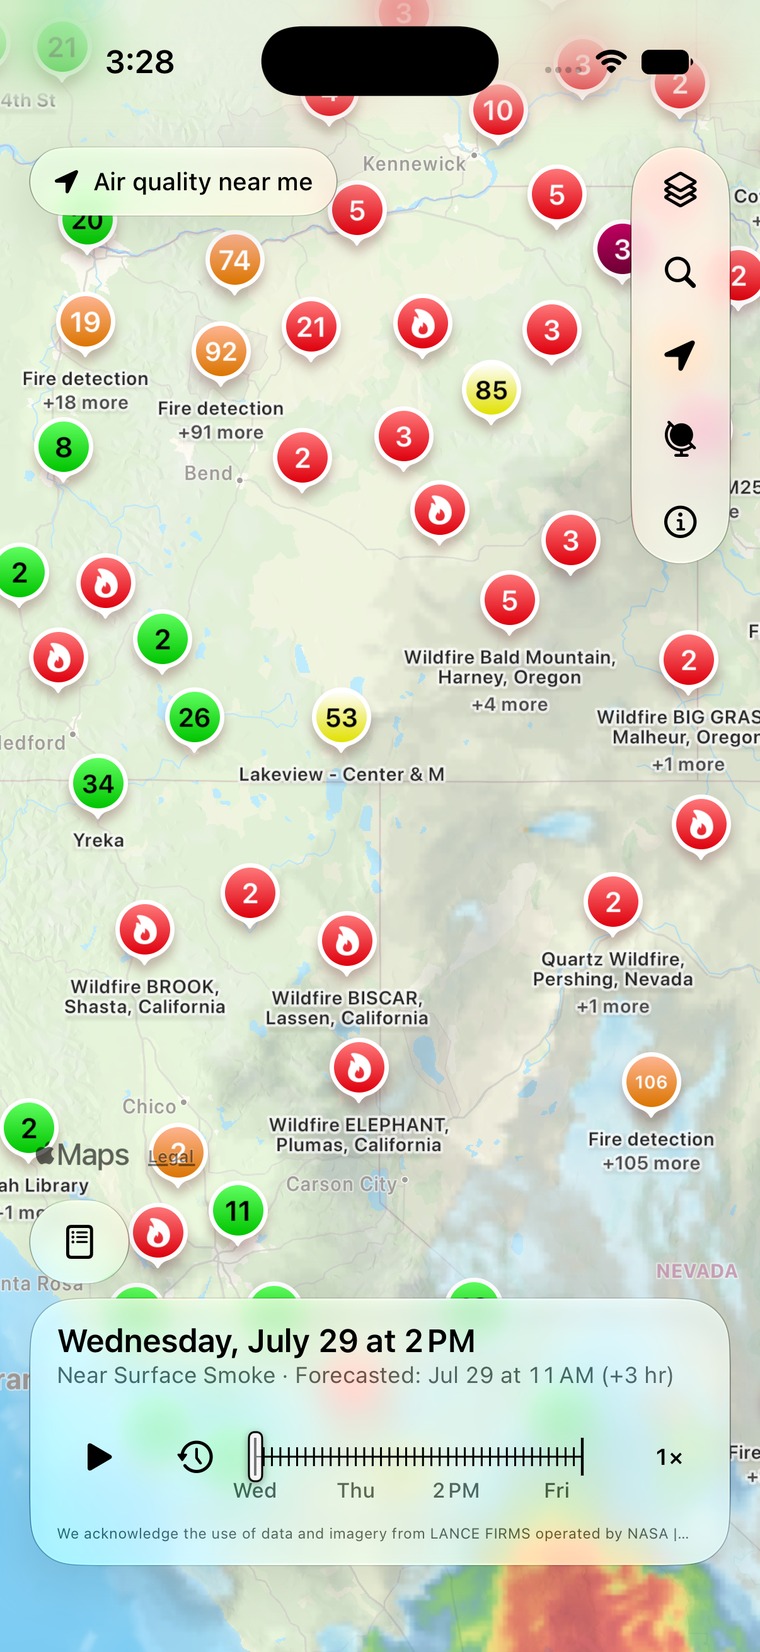
Copernicus CAMS48-hour high-resolution smoke forecasts now include Alaska alongside the continental United States.
NOAA HRRR · 3 km
Worldwide
The global layers come from the Copernicus atmosphere model: wildfire smoke, mineral dust, total haze, surface PM2.5, and volcanic sulfate. Five days ahead, in three-hour steps.
The timeline
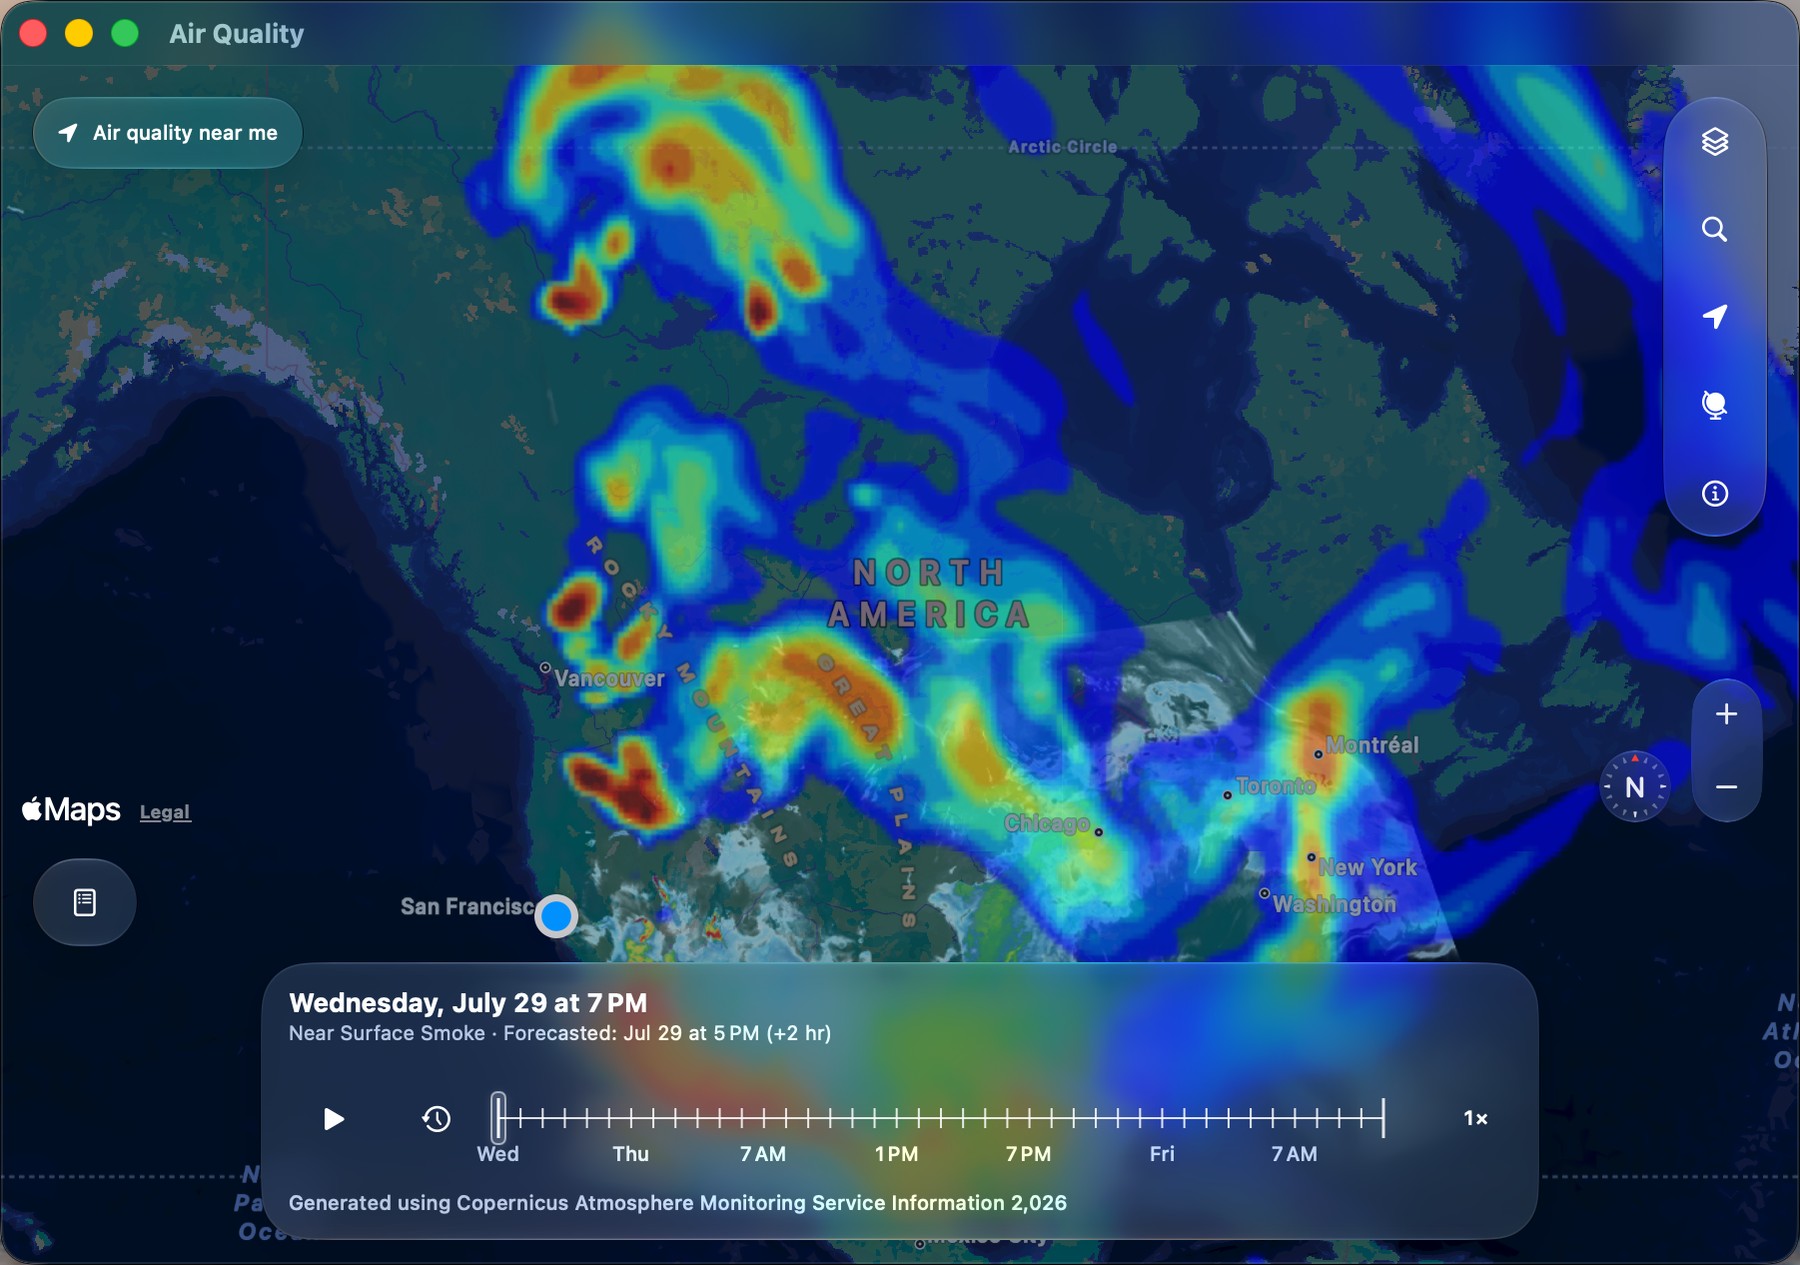
Each forecast layer is a sequence of frames rather than a single snapshot. Drag the timeline to any hour, or play it through and watch a plume move. The scrubber announces each forecast time for VoiceOver, and it also works from the keyboard: space to play, arrows to step.
Layers
Turn on what you need. Each layer names its source in the picker, and all of them are public agency data.
US layers are NOAA HRRR at 3 km; global is Copernicus CAMS.
Named incidents from NASA EONET, hotspots from NASA FIRMS.
Ground truth from monitoring networks, plus a modeled forecast.
Copernicus CAMS aerosol optical depth products.
Locations from the Smithsonian Global Volcanism Program.
NASA GIBS imagery, tiled straight onto the map.
Europe only, from the CAMS European air-quality ensemble.
Tap and hold
Press and hold anywhere on the map and the app fetches a forecast for that coordinate: the current index, the matching EPA health guidance, and a chart of the next five days with a marker for now, so you can see which way it is heading.
Apple Vision Pro
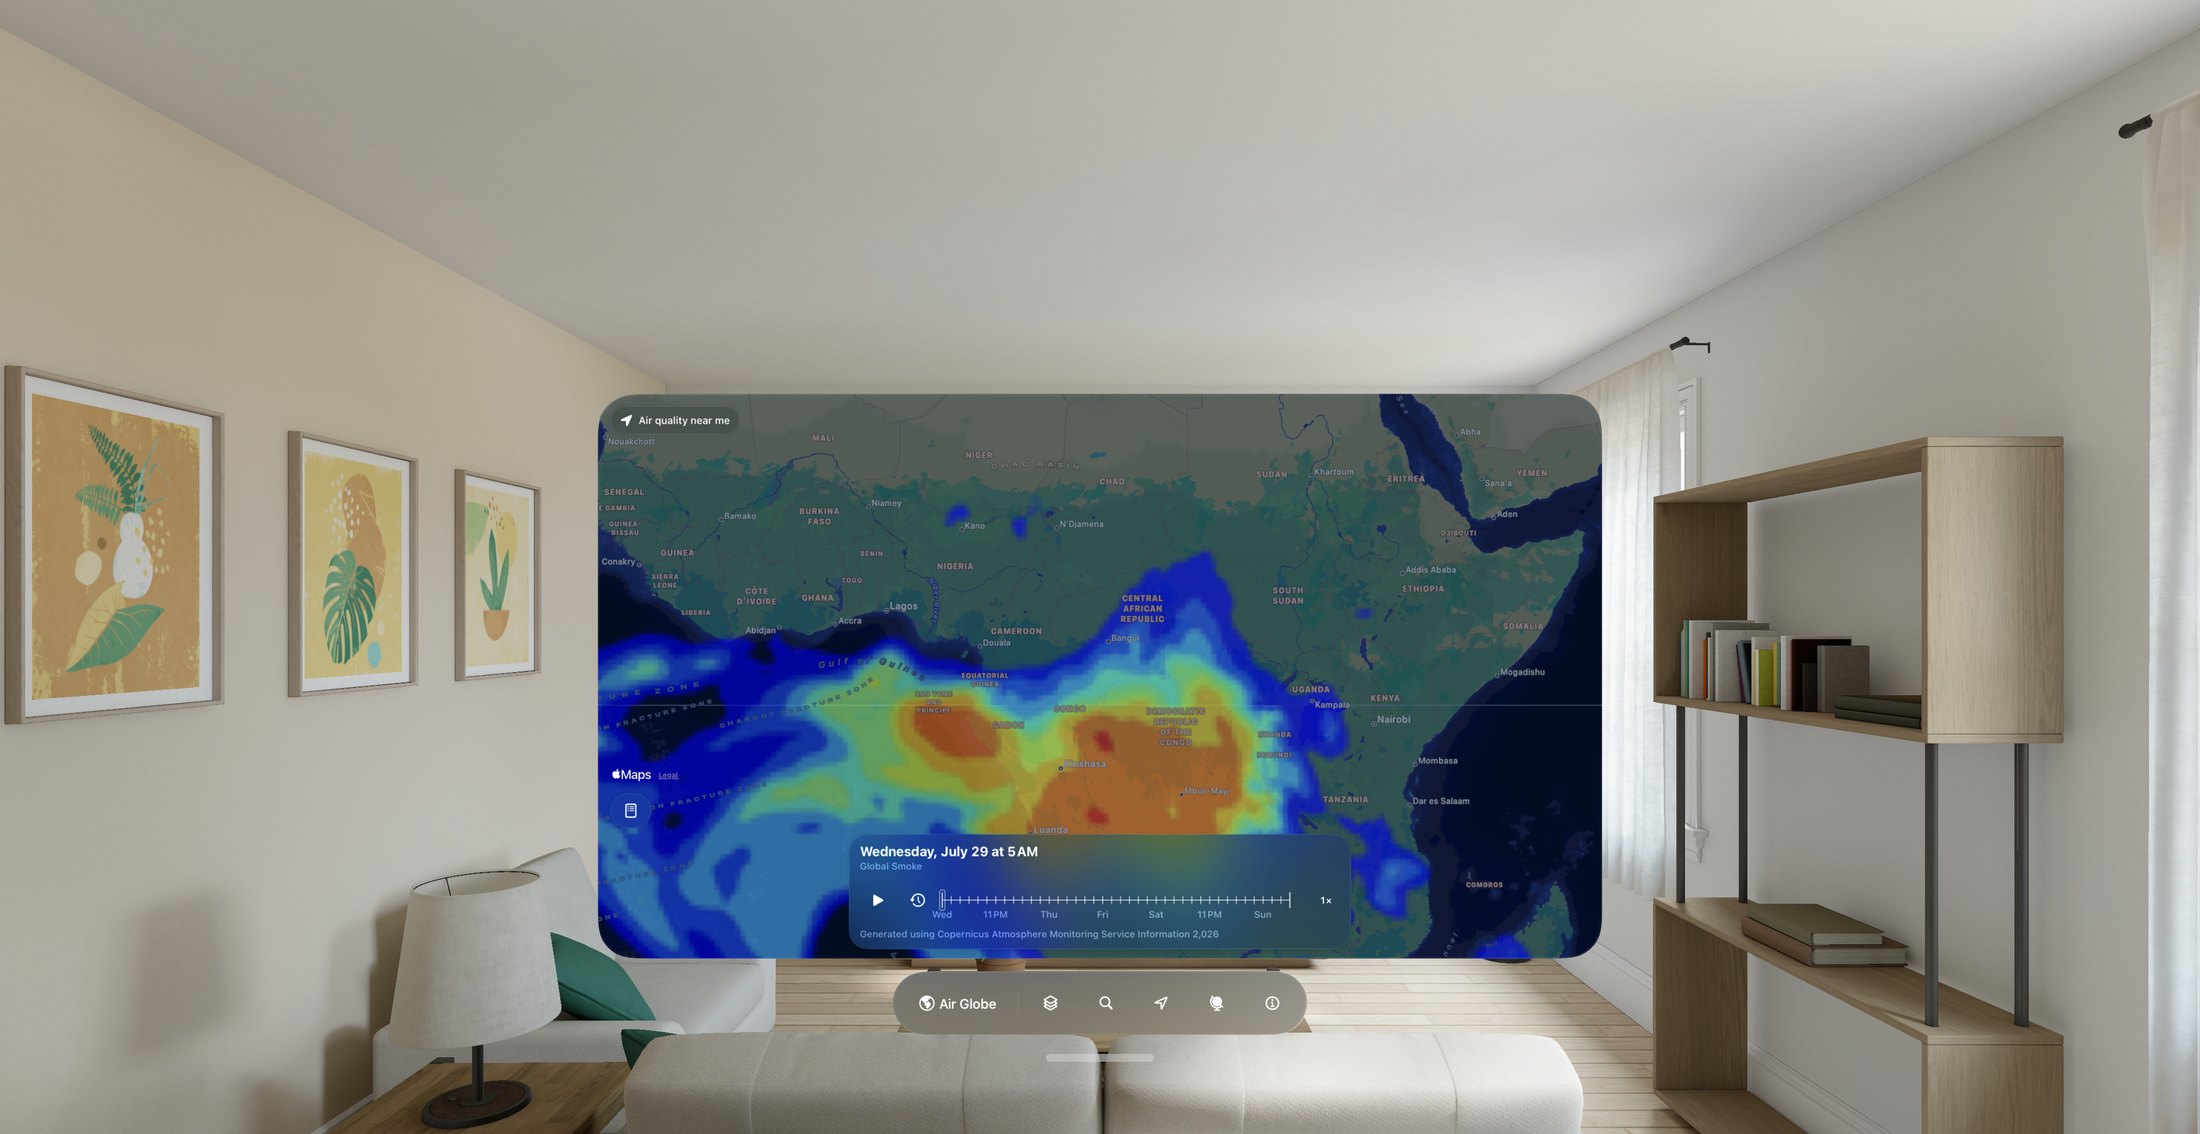
On visionOS the map opens as a window you place in the room, with the controls moved out onto ornaments so they don’t sit on top of it.
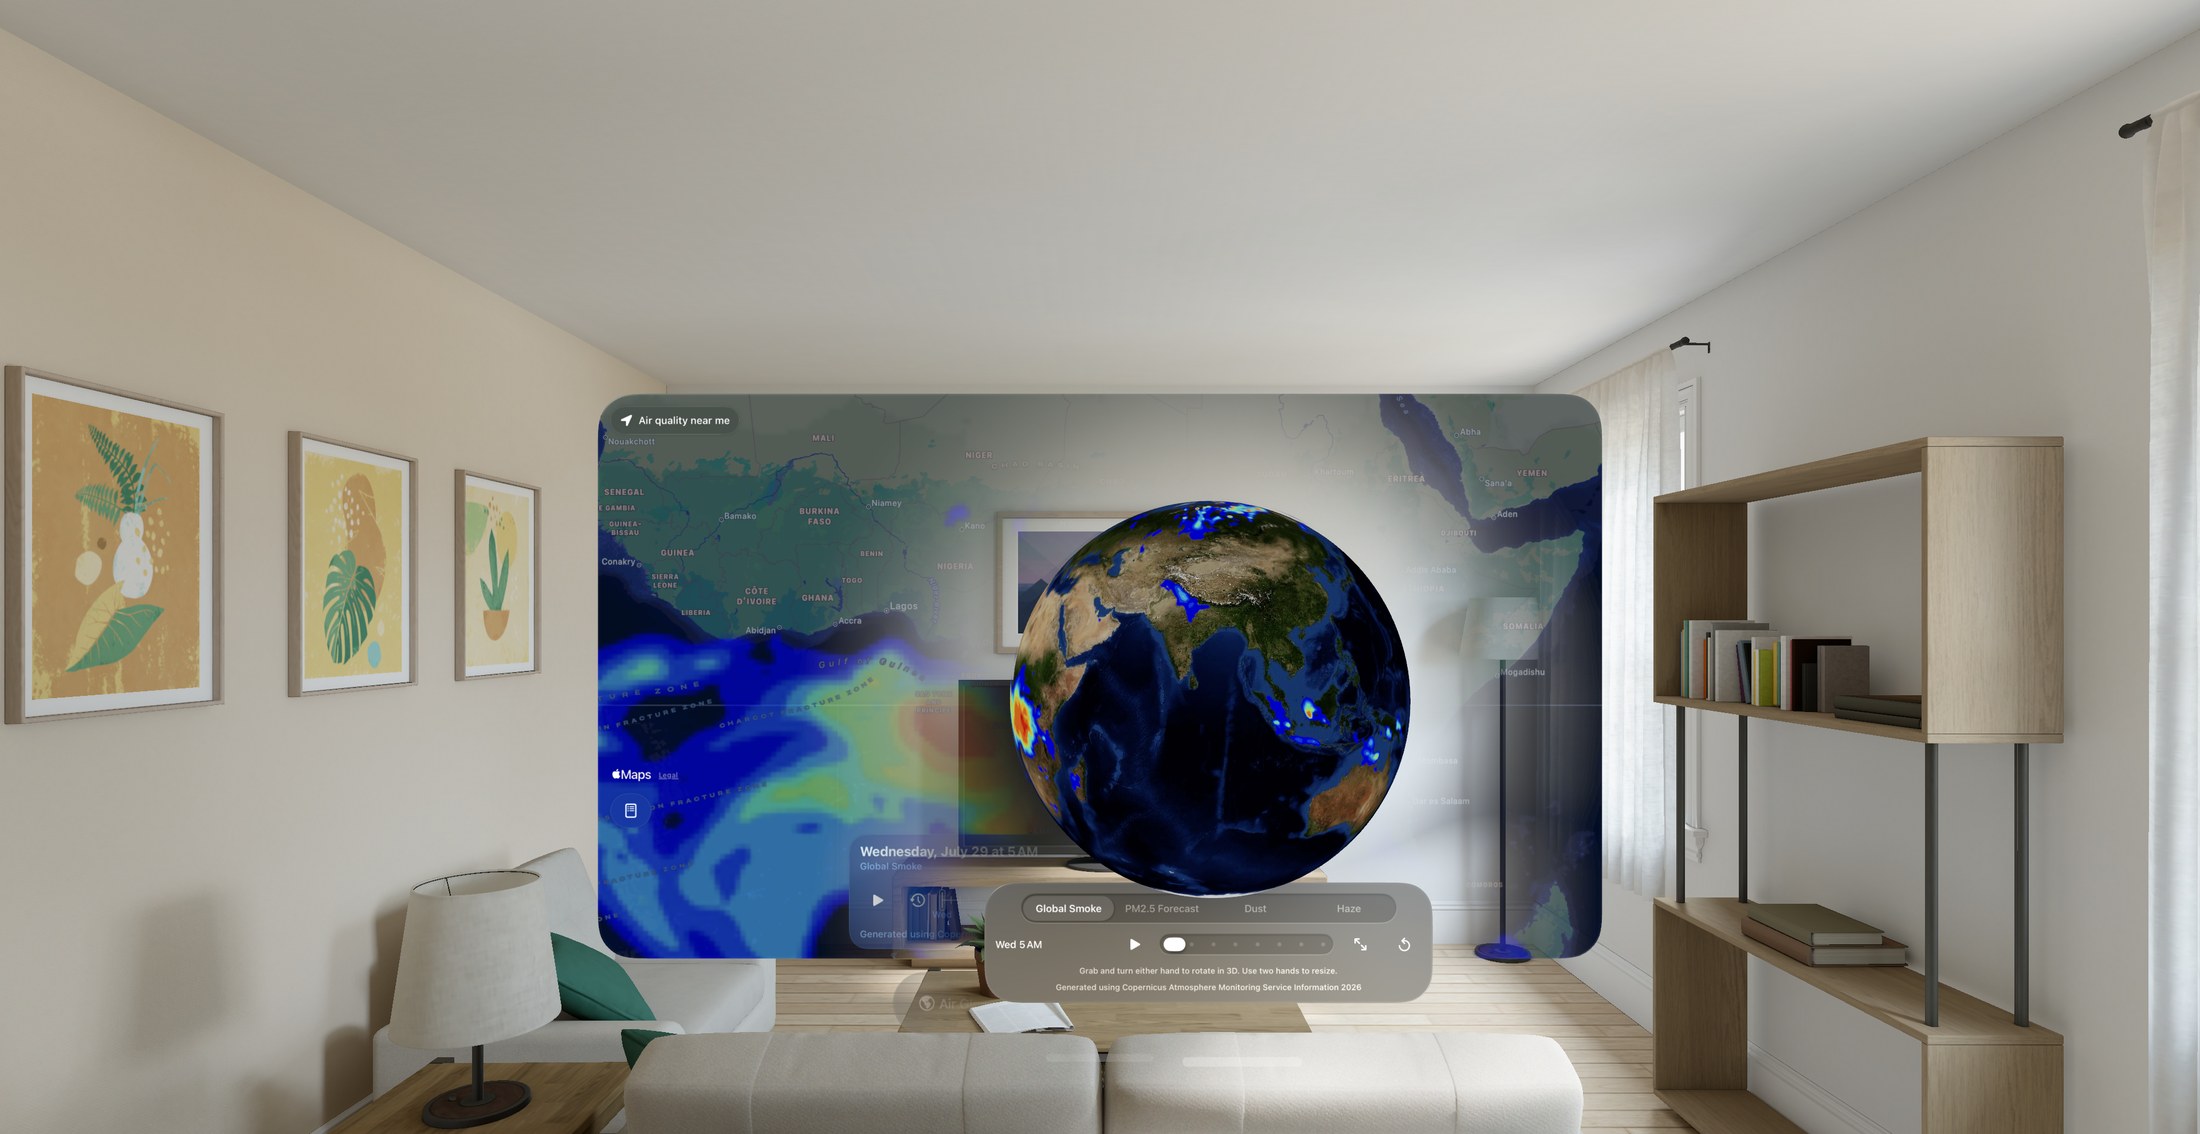
A volumetric window holding an Earth you can reach out and turn, with the global forecast rendered as an atmosphere layer above the surface. Scrub the ornament timeline to animate it, or tap anywhere on the globe for that location’s air quality.
The same globe opens into a progressive immersive space at room size, and you dial how much of your surroundings stays visible.
Layers, search, location, the legend, and the timeline sit on ornaments outside the window, so the map keeps its full surface.

Room scale
The same globe reopens in a progressive immersive space at architectural size — the planet becomes the room, and the Digital Crown dials how much of your surroundings stays visible.
Platforms
SwiftUI and MapKit throughout, with the interface adjusted to how each platform expects panels and windows to behave.
Liquid Glass map controls and system sheets. A Home Screen and Lock Screen widget for any place you pick.
iOS 17 or later
Panels dock to a trailing card rather than covering the map, so layers, forecasts, and the timeline stay visible together.
iPadOS 17 or later
A native AppKit build, not Catalyst. Menu bar, Settings, context menus, and press-and-hold or right-click for a point forecast.
macOS 26 or later
A map window with ornament controls, plus the volumetric Air Globe and a room-scale immersive space.
visionOS 26.5 or later
Reading the map
Sensor readings use the US EPA Air Quality Index, with the EPA’s own colors, ranges, and health guidance. The legend is available at any time and also shows the µg/m³ range behind the smoke shading.
Air quality is satisfactory, and air pollution poses little or no risk.
There may be a risk for people who are unusually sensitive to air pollution.
Members of sensitive groups may experience health effects.
Some members of the general public may experience health effects.
Health alert: the risk of health effects is increased for everyone.
Health warning of emergency conditions: everyone is more likely to be affected.
Our promise
There is no paid tier and nothing held back. If the app is useful to you, a review is the only thing we ask for.
There is nothing to sign into. No analytics, no advertising identifiers, no third-party SDKs. Your location is used on your device and is never sent to us — the only coordinate that leaves it is the point you ask for a forecast at, which goes to the forecast provider and nowhere else.
Provenance
The app doesn’t produce forecasts of its own. It renders published ones and names the source on screen while you’re looking at it.
High-resolution US and Alaska smoke forecasts (HRRR, 3 km, 48 hours hourly) and US air-quality readings via AirNow.
Worldwide smoke, dust, haze, PM2.5, and volcanic sulfate forecasts — five days out in three-hour steps — plus European pollen.
True-color satellite imagery (GIBS), active named wildfires (EONET), and near real-time fire hotspots (FIRMS).
Five-day point forecasts with per-pollutant breakdowns for tap-and-hold locations and for wherever you are.
Community air-quality sensor readings worldwide.
Holocene volcano locations from the Global Volcanism Program.
Controls are labeled for VoiceOver, and the timeline scrubber speaks its forecast times. Text scales with Dynamic Type, and primary buttons stay pinned so they remain reachable at large sizes. Haptics confirm selections, and the map works from the keyboard.
The interface is localized into all 36 App Store languages, with locale-aware dates and units, kept in sync with each release.
العربية · Català · 简体中文 · 繁體中文 · Hrvatski · Čeština · Dansk · Nederlands · English · Suomi · Français · Deutsch · Ελληνικά · עברית · हिन्दी · Magyar · Indonesia · Italiano · 日本語 · 한국어 · Melayu · Norsk · Polski · Português · Română · Русский · Slovenčina · Español · Svenska · ไทย · Türkçe · Українська · Tiếng Việt
Air Quality Index 2.0 for iPhone, iPad, Mac, and Apple Vision Pro.
Free · No subscriptions · No ads · No tracking